Why is my EPC different to my DEC? - a comparison of Energy Performance Certificates and Display Energy Certificates
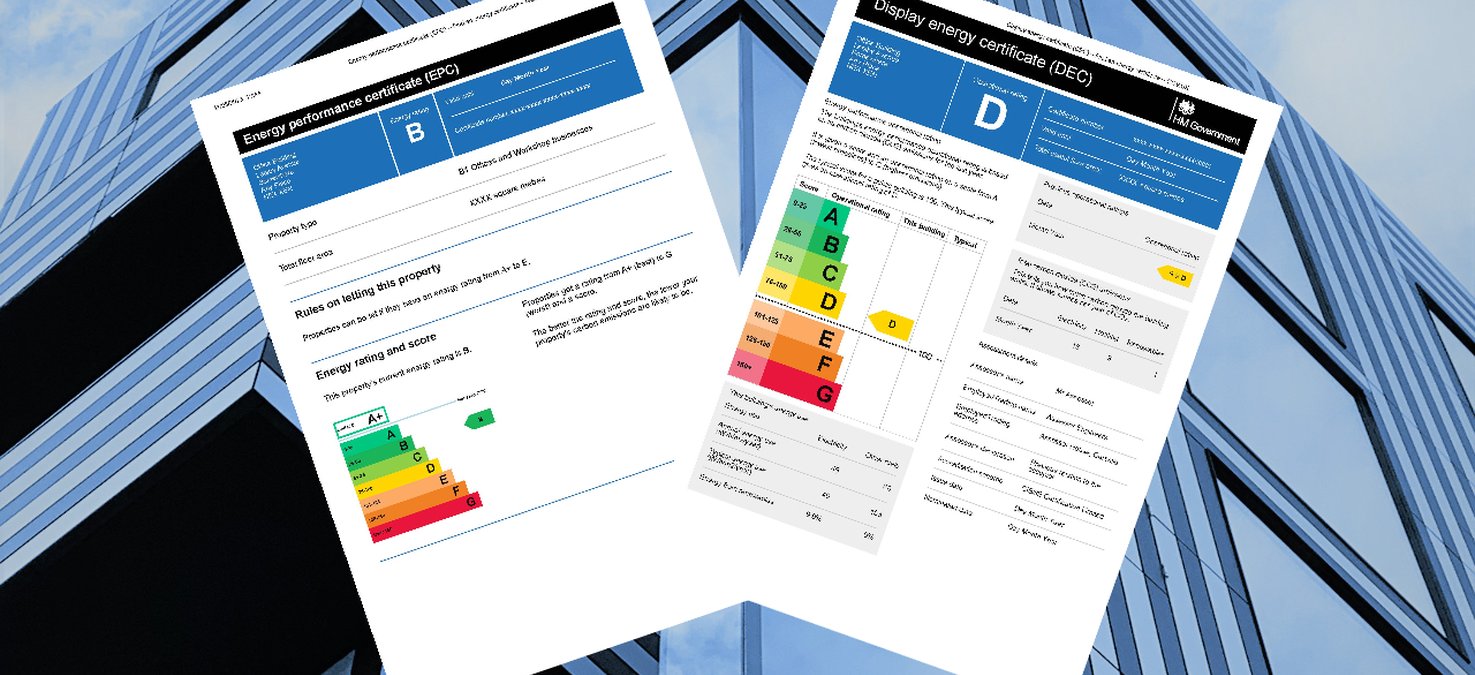
In late 2008, Karl completed an Energy Performance Certificate (EPC) for a 5000 sqm, three storey, new build speculative office building in the North of England. The building consisted of open plan office wings either side of a central lift and stairwell core which also included toilets on each floor and a ground floor entrance and reception area and was the largest building on the site. The EPC had been commissioned by the developer, and the EPC Rating, also known as the Asset Rating (AR), was calculated as a B 39.
In 2010, Karl, at the request of the occupier, prepared and lodged a Display Energy Certificate (DEC) for the same building and this displayed an Operational Rating (OR) of D 99 which is only one point better than a E 100 rating.
The difference between the EPC and DEC rating was a cause of some concern for the developer, who had included a copy of the EPC in various marketing materials for other similar buildings on the development. They would take potential tenants on a tour of the small number of occupied buildings on the site, which would inevitably lead them to the A3 sized Display Energy Certificate in the foyer of the largest building, and very often questions were asked about the difference in the two ratings. The Developer’s remarks that the DEC was based on actual energy bills, seemed to imply to them that therefore the EPC in her marketing material was not very accurate. It should be noted that both EPC and DEC had successfully passed Accreditation Scheme audit.
Some research into the relationship between Asset Ratings and Operational Ratings was undertaken by David Healy BEng, PhD at University of Cambridge in 2011. He points out that the EPC AR is calculated by modelling the building, and its HVAC and lighting systems using either Simplified Building Energy Model (SBEM) software or an approved Dynamic Simulation Model (DSM) application. (Healy 2011)
The building is divided into zones of similar activity and occupancy profile characteristics, together with their geometry (dimensions and zone height), glazing and orientation. How each zone is conditioned is defined i.e., how it is heated (and main heating fuel), cooled, ventilated and the type of lighting used. Next, either default or user-defined values are used to assign U-values to the envelope: walls, floors and roofs, followed by efficiency values for heating, cooling, ventilation, hot water systems and heat recovery plant, mechanical ventilation flow rates are assigned as well as efficacy of installed lighting, air permeability rates, etc.
The energy demands of each zone is calculated by SBEM, according to the activity assigned to it, as each activity type will have different fixed occupancy patterns, serving strategies, temperature set points, standards of lighting, ventilation rates, etc, pre-defined in the software templates (Healy 2011). By carrying out an energy balance based on monthly average weather conditions, energy required for heating and cooling is calculated, and of course for ventilation, lighting and hot water. (Lewry, et al. 2013)
In simple terms, the EPC rating is derived from the calculated energy demands of the building which are converted into carbon emissions based on carbon intensities, in kgCO2/m2 as found in ADL2A. The EPC is calculated by comparing the emissions of the Actual Building with those of a Reference Building. (Healy 2011)
On the other hand, the DEC is calculated by comparing the building emissions calculated from actual energy consumption, with the CO2 emissions of a typical, benchmark building as defined by CIBSE.
The major differences between EPC and DEC ratings and the way in which carbon emissions are indicated are (Healy 2011):
- Non-standard use: the AR is designed to reflect the energy performance of the building based on how it is built, and the HVAC and lighting systems installed in it, and standard use is assumed (fixed occupancy patterns, servicing strategies, temperature set points, standards of lighting, ventilation rates, etc). The AR does not allow for the possibility that the building will be used inefficiently. The OR is based on actual consumption data and is compared to a benchmark for that building type.
- Healy states that the difference between predicted and actual energy consumption due to non-standard use cannot be corrected for.
- Unregulated Energy: Energy that is used by the building services that provide heating. Cooling, ventilation, lighting and water heating and therefore controlled through the Building Regulations is called Regulated Energy. Unregulated energy, on the other hand, is gas and electricity used to power computers, office equipment, catering and kitchen appliances, lifts, escalators, shutters, external lighting, fire and security systems and other process loads. Unregulated energy is accounted for in the OR, but not in the AR. Healy outlines a method of making partial corrections to the AR based on equipment benchmarks.
- Different Carbon Intensities: In simple terms, the AR is derived from the calculated energy demands of the building which are converted into carbon emissions based on carbon intensities, in kgCO2/m2 as found in ADL2A. The OR uses values from the CIP file and there were minor variations for electricity between CIP and values in ADL2 2006, and minor variations across the board in ADL2 2010. Again, Healy states that this could be corrected for in order for more direct comparison of OR with AR. (see Table below)
|
Fuel
|
CIP kgCO2/kWh
|
ADL2 (2006) kgCO2/kWh
|
ADL2 (2010) kgCO2/kWh
|
2013
|
2021
|
|
Anthracite
|
0.317
|
0.317
|
0.318
|
0.394
|
0.395
|
|
Biogas
|
0.025
|
0.025
|
0.018
|
0.098
|
0.024
|
|
Biomass
|
0.025
|
0.025
|
0.028 (pellets) / 0.09 (chips)
|
0.031
|
0.029
|
|
Coal
|
0.291
|
0.291
|
0.301
|
0.345
|
0.375
|
|
Grid displaced electricity
|
0.55
|
0.568
|
0.529
|
0.519
|
Vary by month, eg:
0.163 in Jan,
0.111 in Jul,
PV systems, eg:
0.196 in Jan,
0.092 in Jul
|
|
Grid supplied electricity
|
0.55
|
0.422
|
0.517
|
0.519
|
Vary by month, eg:
0.163 in Jan,
0.111 in Jul
|
|
Liquid propane gas
|
0.234
|
0.234
|
0.245
|
0.241
|
0.241
|
|
Natural gas
|
0.194
|
0.194
|
0.198
|
0.216
|
0.21
|
|
Oil
|
0.265
|
0.265
|
0.274
|
0.319
|
0.319
|
|
Smokeless
|
0.392
|
0.392
|
0.347
|
0.433
|
0.366
|
|
Dual fuel (mineral and wood)
|
N/A
|
0.187
|
0.206
|
0.226
|
0.087
|
|
Waste
|
N/A
|
0.018
|
0.058
|
0.058
|
0.015
|
Table 5: Carbon Intensity values as defined in CIP file, ADL2(2006), ADL2 (2010), ADL2 (2013) & ADL2 (2021)
- Normalisation of AR and OR scales: For EPC’s, the AR scale is linear, and the zero point is the performance of a building that has zero net annual CO2 emissions. The border between a B and C is set at 50, and the boundary of D and E gives a rating of 100. The AR for a typical building will usually be close to a rating of 100. For OR’s, the scale is also linear, and is fixed by two points: zero emissions at the top of Band A, and the stock average (the benchmark for that type of building) being at the border of D/E. (Healy 2011)
- Separable Energy Uses: separating out some types of energy uses can increase the relevance of the OR, particularly if the energy use is not included in the building’s benchmark. Where these particular types of energy use is not separated out, they can often be partially responsible for the OR being higher than the AR.
- Healy obtained a database of 56,481 buildings from the Landmark Register, and after applying a validation and filtration process, studied ninety-nine of these buildings that had both DEC’s and an EPC. He defined a corrective procedure for normalising the AR scale so that a more direct comparison of AR with OR could be made (Healy 2011). He also made several recommendations that over time could strengthen the correlation between them.